Catch downtime
before your users do.
PulseWatch watches your sites and services around the clock and tells you the second something changes. One command installs the desktop app, and your first 10 monitors are free.
Trusted by self-hosters, homelabbers and small teams
// why it works
Three things, done well.
The Overview is built around one job: knowing the state of everything without digging.
Read the room in seconds
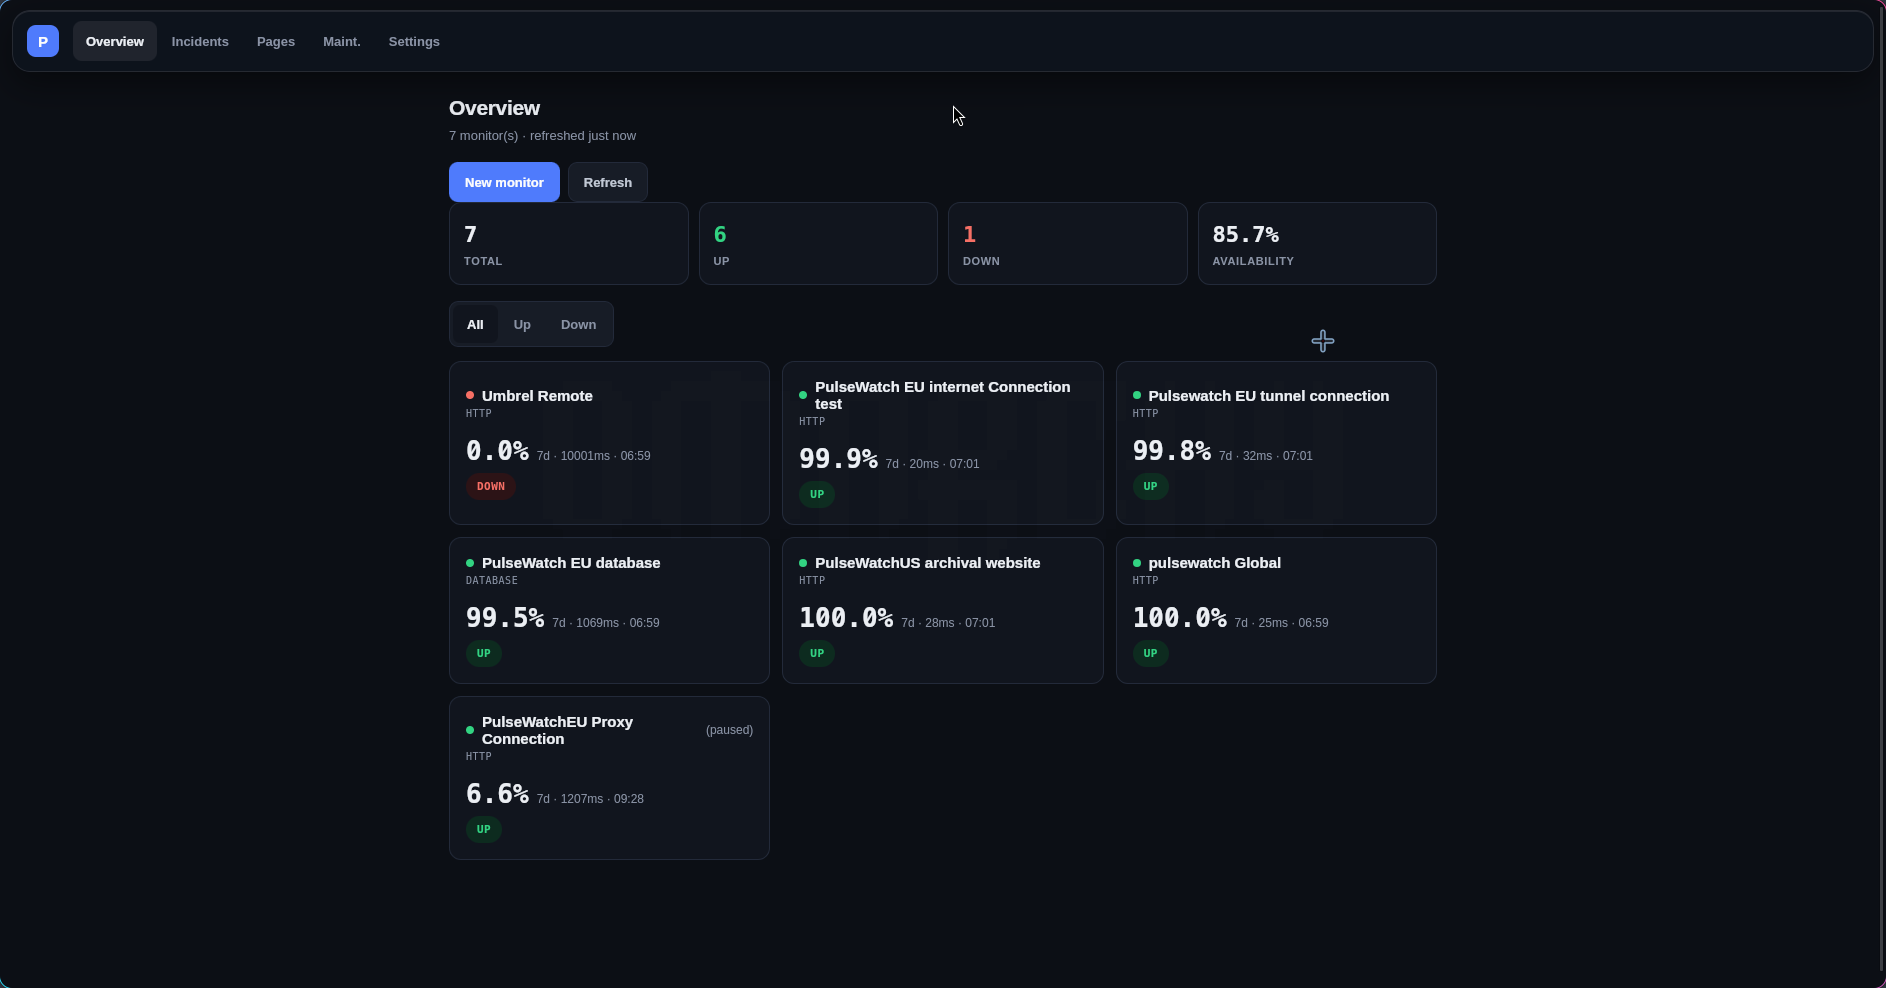
Four numbers up top: total, up, down, availability. You know the state before you scroll.
One card per monitor
Name, protocol, 7-day uptime, last check, and a state badge. No clicks to know where things stand.
Built for routines
Filter to what is down, fix it, refresh. Paused monitors stay marked and out of the way.
// inside
What is inside.
Five tabs, one shell. Everything answers to the same Overview.
A calm home screen
Totals, filters, and monitor cards. The page you leave open on a second screen.
Failures with a timeline
A dedicated tab for incidents, separate from the healthy noise.
Status pages in the same shell
Manage public status pages next to the monitors they report on.
Maintenance windows
Silence known work so planned changes do not look like outages.
All, Up, Down
One tap to see only what hurts right now.
Yours to arrange
Add a monitor with one button and a URL. Pause what you do not need.
// proof
Watched by our own instance. 7 monitors, 3 views, 30 days of check history.
The screenshot above is our own dashboard. We watch PulseWatch with PulseWatch, and publish the result on the public status page.
// install
Two ways to run it.
The desktop app
Same Overview as the browser, in its own window.
curl -fsSL https://pulsewatch.pignatiello.online/install.sh | sh -s -- desktopThe CLI
One binary, no window. Pipe the script to sh and it installs itself.
curl -fsSL https://pulsewatch.pignatiello.online/install.sh | shYour monitors deserve better than a spreadsheet.
PulseWatch is hosted and always on. One command installs the desktop app, or open the dashboard in your browser.